KARTIKEY SAINI | ANALYST & RESEARCH SPECIALIST

Passionate about transforming raw data into actionable intelligence, optimizing decision-making, and automating workflows for improved accuracy and performance.
Continuously exploring innovative data science applications to enhance business impact.
Portfolio
Welcome to my portfolio! Here, you’ll find a showcase of projects where I’ve applied data analytics, machine learning, and business intelligence to solve real-world problems.
I specialize in working with SQL, Python, Power BI, Excel, and Machine Learning to extract insights, automate workflows, and build interactive dashboards. Whether it’s data cleaning, predictive modeling, or visualization, I leverage these tools to transform raw data into meaningful business decisions.
Explore my projects below to see these skills in action!
Selected Projects in Data Science, Machine Learning, and NLP
HR Analytics
A comprehensive Power BI solution to help HR teams make data-driven decisions efficiently. This dashboard consolidates key workforce insights such as headcount, gender and age analysis, salary trends, staff growth over time, and leave balance.
View the GitHub RepositoryCognos : Retail Store Analytics
Developed a comprehensive analytics solution to help businesses make informed decisions efficiently. This dashboard consolidates key insights such as revenue trends, customer demographics, product performance, and regional sales analysis.
View the GitHub RepositoryHealth Data Analytics
Built an interactive Power BI dashboard to analyze patient admissions, test results, billing trends, and demographics. Extracted key insights on hospital resource planning, insurance coverage impact, and medication effectiveness from a neutral dataset.
View the GitHub RepositoryBike Sales Dashboard
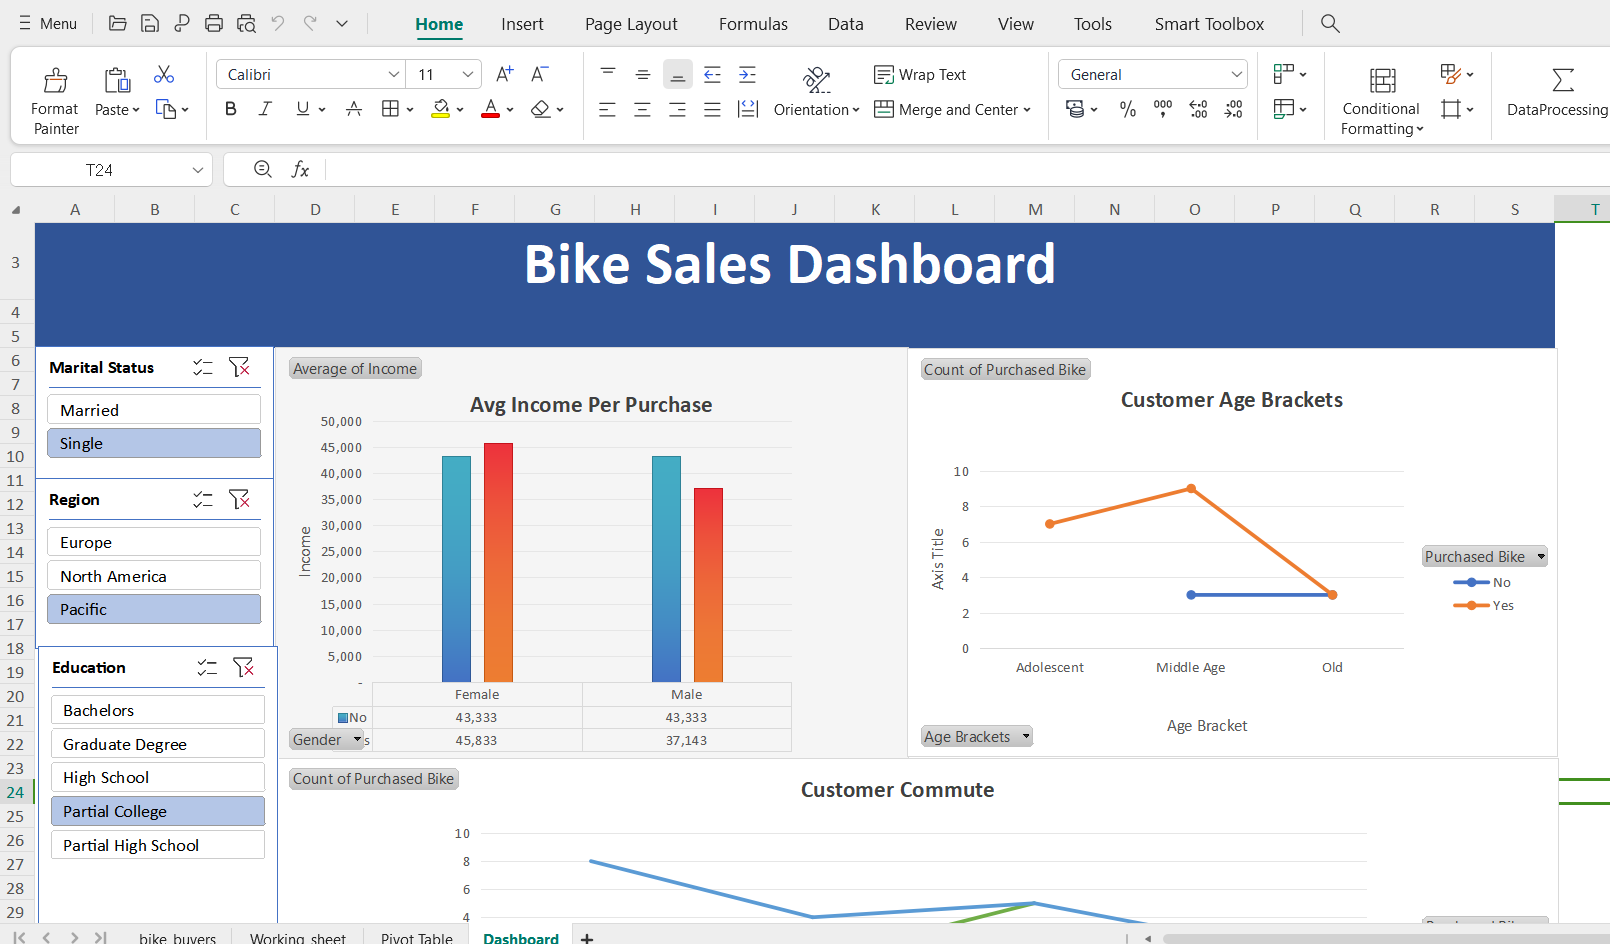
Created an interactive Excel dashboard to analyze customer demographics and purchasing behavior.
- Average Income by Purchase: Segmented by gender, marital status, and region.
- Customer Age Brackets: Visualized purchasing behavior across different age groups.
- Filters and Interactivity: Slicers for region, marital status, and education.
 View the GitHub Repository
Service Sales Analysis Report
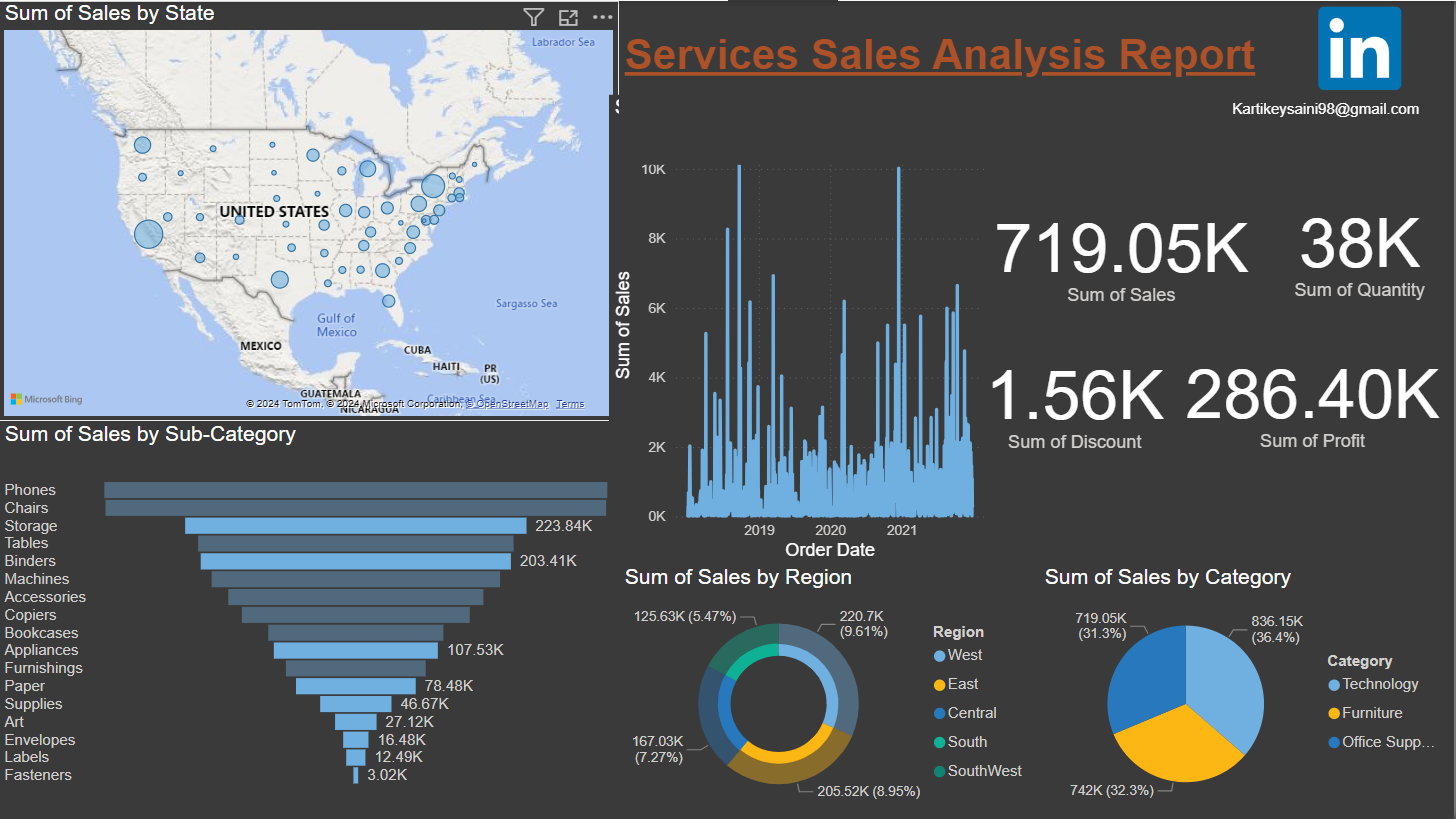
This Power BI dashboard showcases a comprehensive sales analysis for services across different categories and regions.
- Top Categories: Phones and Chairs lead the sales.
- Regional Sales: Identified high-growth areas in the South and Southwest.
- Profit Margins: Strategic discounting contributed to a **286.40K total profit**.
 View the GitHub Repository
COVID-19 X-Ray Image Classification
Implemented Convolutional Neural Networks (CNNs) to detect COVID-19 from X-ray images. Utilized ResNet50 for improved classification accuracy.

View the GitHub Repository
Glassdoor Data Cleaning Project
Cleaned and structured job listing data scraped from Glassdoor to improve usability and insights.
 View the GitHub Repository
Emotion Detection Using NLP
Used Natural Language Processing (NLP) techniques like vectorization, tokenization, and SVM classifiers to detect emotions in text.
 View the GitHub Repository
Basic ATM Code in Python
A simple **ATM simulation** written in Python, helping beginners understand **loops and functions**.
 View the GitHub Repository
Power BI Dashboard on COVID-19
Developed an interactive Power BI dashboard visualizing COVID-19 cases worldwide.
 View the GitHub Repository